THE CFTC COMMITMENTS OF TRADERS REPORT · 44 US FUTURES MARKETS
Know when you are the crowd. Then size for it.
MEASURED, NOT PREDICTED: THE MEDIAN CROWD TRADE FIRST RAN 2.7% AGAINST ITS TAKER · 80 OF 100 TURNS NEEDED UP TO 26 WEEKS
We read the CFTC positioning report for you, count what happened after every crowd extreme since 2006, and tell you what the trade cost the people who took it. 1,206 cases on file, wins and misses, nothing deleted.
20 YRS OF RECORD · ONE FROZEN RULE · TESTED ON UNSEEN YEARS SINCE 2019
This week · 9 of 44 markets are crowded
data through Tue, Sep 15 · next report Fri 21:30 CET
| Market | Crowd | How one-sided | Weeks | Since Tuenowcast, pts of OI · its own hit rate | On fileextremes since 2006 | Stop & waitthis market’s own |
|---|---|---|---|---|---|---|
| UST 2Yrates · crowd long | 99 of 100 | 🔒 PRO | ||||
| WHEAT HRWgrains · crowd long | 98 of 100 | 🔒 PRO | ||||
| CORNgrains · crowd long | 99 of 100 | 🔒 PRO | ||||
| RBOBenergy · crowd long | 97 of 100 | 🔒 PRO | ||||
| SOYBEANSgrains · crowd long | 96 of 100 | 🔒 PRO | ||||
| SOYBEAN MEALgrains · crowd long | 100 of 100 | 🔒 PRO | ||||
| WHEAT SRWgrains · crowd long | 96 of 100 | 🔒 PRO | ||||
| LEAN HOGSlivestock · crowd short | 98 of 100 | 🔒 PRO | ||||
| UST 5Yrates · crowd long | 100 of 100 | 🔒 PRO |
swipe the table →
Across every comparable case since 2006, pooled over all 44 markets: 38 in 100 turned inside eight weeks against 37 in an ordinary week · n=580. The median run against the trade before it worked was 2.7%, and 80% of the turns that happened landed inside 26 weeks. Pooled is one number for all 44 markets, so it sizes none of them. Pro replaces both with this market’s own.
Get this market’s own numbers →Why not just a free COT chart?
Every free COT site shows the same thing: who is long, who is short. None of them tells you what happened next. That is the product here. Chart sites sell data: we publish what the data was worth. Gurus sell rules of thumb: we publish the count, how often the rule actually paid. Signal sellers show their winners: our losing files stay up forever. Most comparable setups did not pay, and we print that on every file. The rules were built on 2006–2018, checked on years they had never seen, and every table is public. No chart site estimates positioning between the Fridays, and no signal seller shows you their losing trades: both are on this site.
Attack our numbers: the methodology, tables included →So you wait for confirmation
That is the part that gets worse, and it gets worse every time.
We pre-registered three levels of confirmation and published all three: every layer you add makes the expectancy worse, roughly 0.02R each, monotonically, in both eras. Confirmation buys comfort, not edge · what nobody measured for you is what the trade costs while it works. every setup we killed, including ours →
Friday’s report, in one sentence
data through Tue, Sep 15 · next report Fri 21:30 CET
The crowd is stretched in 9 markets. The most stretched: UST 2Y, long for 7 weeks straight.
The crowd here is the big speculators: the funds and traders betting on direction, not the companies hedging a business.
THE WHOLE TAPE: crowdedness at 89 of 100 vs every week since 2006 · measured across all 44 markets
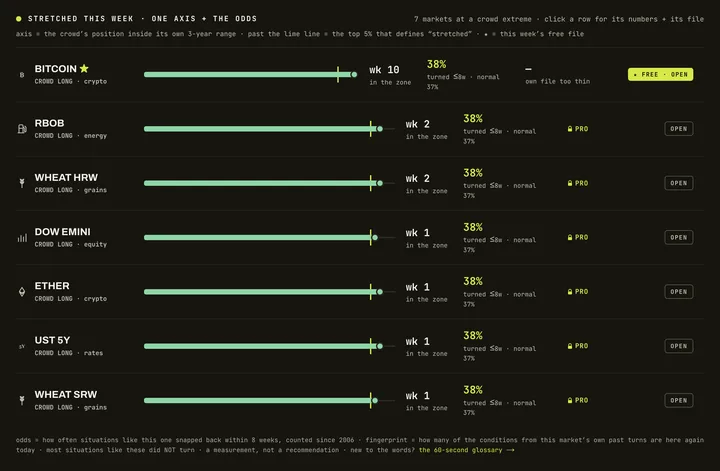
Across all 44 markets the crowd has been this one-sided and long 580 times since 2006. 219 of them turned inside 8 weeks: 38 in 100. A normal week does 37 in 100.
Those two numbers are almost the same, and that is the finding. Crowded, on its own, is not a trade. These are counts, not predictions.
STRETCHED RIGHT NOW · 9 OF 44
When a market qualifies we take the fade in public and grade it for 13 weeks, win or lose.
The most recent case that never turned: WHEAT HRW #32. Thirteen weeks in, it cost 4.4%. Every miss stays on the site.
So what does Pro buy
Three answers your entry never had.
None of them is a buy signal. All three are measured, graded in public, and shown with the sample they rest on.
Daily
The report you read Friday is Tuesday’s book.
We estimate what the specs have done since, in points of open interest, every day, on all 44 markets · and grade every estimate against the real print the following Friday. Same sign or nothing, no partial credit.
a single-variable walk-forward model: price move to positioning change · the median market has run 62% on direction over its last 52 graded weeks, and any market under 55% says so on its own scorecard · what it adds over guessing the sign is the SIZE of the move, per market
9 of 44
Which markets deserve your week.
Six checks per market against its own turn record. Usually three to five qualify. The rest we tell you to skip, which is most weeks and most markets.
extremes matching the measured turn conditions ran +0.50R better in 2006–2018 and +0.22R in 2019+ than those that failed the gate · a priority map, not an entry edge: our own mechanized protocol still went −0.04R out of sample and we print that too
1,206
The worst you would have sat through.
Size from the worst run on file, not the average. Every file carries this market’s own median shakeout, its 75th percentile, its worst case and the number of cases behind each.
a stop tighter than the shakeout takes you out of the trades that worked · a number never carries a market’s name on fewer than five cases, it falls back to the pooled curve and says so
Pro
Everything free, on all 44 markets, plus the numbers you size from.
✓This market’s own stop · its median shakeout and worst case, not the pooled curve
✓The full confirmation layer · six checks on every market, not just the free one
✓The daily nowcast inside every file · never trade a 3-day-old report
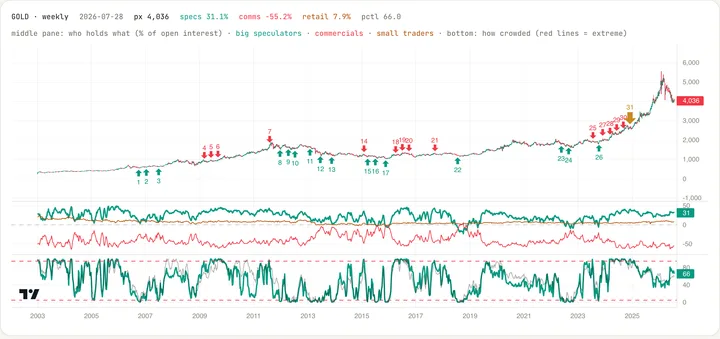
✓Every past trade numbered on the chart · winners and losers, never deleted
✓Daily tape alert on the markets you star · plus the Friday watchlist
€9/month
or €7.50/month billed €90 a year · save €18
Start Pro · €9/month →30 days. Not useful? Write to us and we refund it.
cancel anytime · unlocks in seconds · incl. VAT where applicable
Rather own it than rent it
The research pack · €149 once
The same census, delivered once, no renewal. If you trade one or two markets and size them the same way every time, buy this instead of subscribing.
THE FORWARD TEST · GRADED FRIDAYS · WIN OR LOSE
THE LATEST COT REPORT · DATA THROUGH TUE, SEP 15
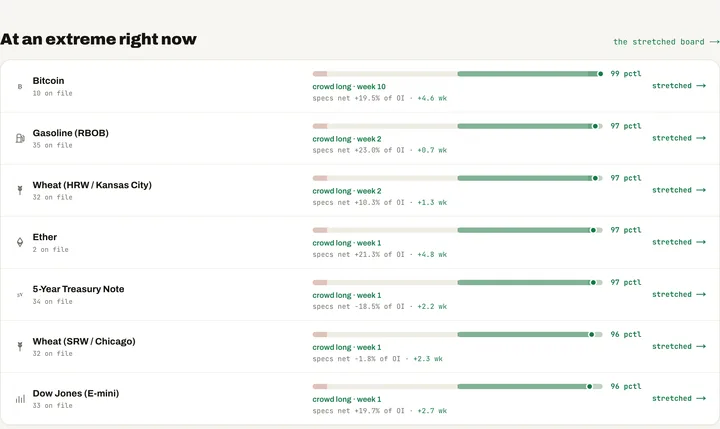
All 44 markets, every week: who is long, who is short, how stretched against its own 3 years · grouped by asset class, most stretched first, free. Free chart sites stop there. Each market’s file adds what happened next.open the whole board →Friday’s report is already 3 days old when you read it.
Our nowcast estimates what the specs have done since, every day, on all 44 markets. That’s the SINCE TUE column above.
62%
directionally right, last 52 weeks (median market) · see the scorecard →
the receipts every signal-seller hopes you never check
Which weeks deserve a trade? We graded all 1,206.
Of those, 1,192 have a graded outcome, and the crowd reversed inside the 13-week window in 41% of them. Fewer than half. That is the answer nobody selling COT signals will give you. Every case is here, free, wins and losses, none deleted, our own failed protocol included. Pro is the weekly verdict on top of your own read: each crowded market graded on its record, what marked its past turns and whether any of it is on today’s tape, the stop that survived, and how long the wait ran · the layer of measurement over the entry you already trade.
Every case since 2006
How often each crowd extreme actually turned, the wait, the worst it ran against you. All 44 markets.
The odds on every stretched market
The turn rate and snap-back odds on every crowded market the week it is crowded, not just the one free file.
The turn fingerprint
The exact conditions at this market's past turns, checked against today's tape.
 THE COT REPORTSAll 44 markets →Who holds what this week: the full report, the book and the chart, for any market.
 THE CONFIRMATION LAYER9 markets on watch →Six checks on every crowded market: conditions, the first close, the stop, the wait.
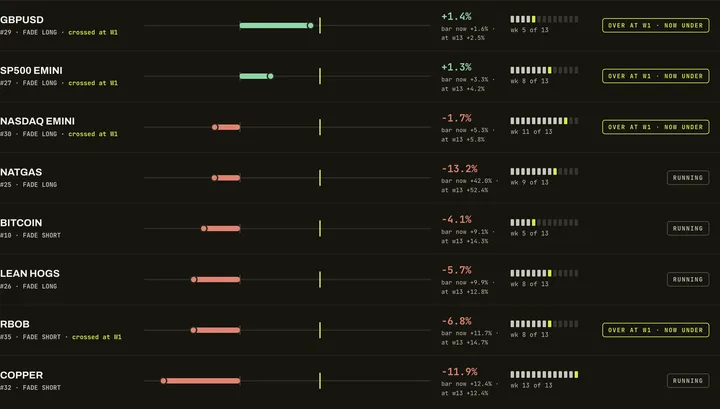 OUR OWN TRADES2 open, win or lose →Every fade we took, marked in public, never deleted.
 THE BACKTESTS1,206 extremes since 2006 →How often crowding actually turned. The failures too.
1,206
times the crowd hit an extreme since 2006 · every case tested, none hidden
489
turns studied: what was true at each one, what marked it, how much of the move was left
43
markets backtested, 20 years, one frozen rule
9
markets crowded right now, one file is free, every file open to you
And this is where all of it comes from. The CFTC publishes one table every Friday. Everything on this site is read out of it, in public, with nothing added.Built in Vienna by Ventus XII Management GmbH. who we are →Our own open bets, losses included, stay published on the record →
Big speculators are betting on rising prices, a bigger bet than in 99% of the last 3 years.
chance it snaps back within 8 weeks · every case like this since 2006 · any random week: 37%
the pros on the other side (hedgers): measured in the file
The Friday Letter
Every Friday 21:30 CET the new report lands and we regrade all 1,206 cases overnight. Confirm and your crowd-map snapshot arrives right away. Then every Friday: what moved, where the crowd is stretched, and which fades are running in public. And the moment we open one, you get the ping. Free.
Every Friday: where the crowd is stretched, what is running, what it cost. Free.
Confirmation by e-mail, one-click unsubscribe in every issue. Your address is never shared.
Counted from the CFTC’s own Commitments of Traders report · 44 markets · 1,206 crowd extremes since 2006 · one rule, unchanged, tested on 2019+ · years it had never seen.